When you want to analyze signals, you often hear about FFT and spectrum analyzers. Both tools help to look at frequencies in audio, radio, and other electronic signals. But they are not the same, and each has its own strengths. Understanding the differences can help you make better decisions in engineering, music, or research.
This article explains what FFT and spectrum analyzers are, how they work, and where they fit in real-world use. We’ll look at practical examples, compare features side-by-side, and highlight mistakes beginners often make. If you’re confused about which tool to use, or how they relate, you’ll find answers here.
What Is Fft?
FFT stands for Fast Fourier Transform. It’s a math algorithm that breaks a signal into its frequency parts. If you have a sound wave, the FFT shows which frequencies are present, and how strong they are.
The FFT is just a calculation—it does not measure anything by itself. You need data first, usually from a microphone, sensor, or other device. FFT is used in software programs, digital oscilloscopes, audio editing tools, and more.
How Fft Works
Imagine you record a sound on your computer. The sound is just a series of numbers (digital signal). FFT takes these numbers and quickly finds out how much of each frequency is inside. It gives you a spectrum, which is a graph showing frequencies on the x-axis and amplitude (strength) on the y-axis.
The main advantage of FFT is speed. Before FFT was invented, breaking down signals was slow and needed more computer power. FFT made it possible to analyze signals in real time.
Fft Applications
- Audio analysis: Find out which frequencies are in a song or speech.
- Communications: Check signals in radios and cell phones.
- Medical devices: Analyze heartbeat or brain signals (ECG, EEG).
- Engineering: Detect vibration problems in machines.
Common Beginner Mistakes With Fft
- Ignoring windowing: FFT expects signals to be continuous. If you analyze a short piece, you need a window function. Without it, you get “leakage”—false frequencies.
- Misreading units: FFT results are not always shown in real-world units (Hz, dB). Software may show “bins,” which need to be converted.
- Expecting perfect frequency detection: FFT has limits. The accuracy depends on the sample rate and the number of points analyzed.
What Is A Spectrum Analyzer?
A spectrum analyzer is a tool—hardware or software—that measures the spectrum of a signal. It shows which frequencies are present, just like FFT, but it is usually a complete device with a display, controls, and sometimes input connectors.
Spectrum analyzers can be analog or digital:
- Analog spectrum analyzers: Use filters to separate frequencies.
- Digital spectrum analyzers: Use FFT or other algorithms to process digital signals.
How Spectrum Analyzers Work
A spectrum analyzer takes an input signal (audio, radio, etc. ), processes it, and displays a graph. The graph shows frequency vs amplitude, usually in real-world units like Hz (frequency) and dB (amplitude). You can use them to see if a signal is clean, has noise, or is interfering with other signals.
Types Of Spectrum Analyzers
- Audio spectrum analyzers: Used for music, speech, or studio work.
- RF spectrum analyzers: Used for radio, wireless devices, and antennas.
- Portable spectrum analyzers: Compact tools for fieldwork.
- Software spectrum analyzers: Apps for computers or smartphones.
Common Features
- Adjustable frequency range
- Adjustable amplitude scale
- Markers to find exact frequencies
- Save and export data
- Real-time or slow scan modes
Fft Vs Spectrum Analyzer: Key Differences
Many people think FFT and spectrum analyzers are the same, but they are not. FFT is a method; spectrum analyzer is a tool. Let’s compare them side by side.
| Feature | FFT | Spectrum Analyzer |
|---|---|---|
| Definition | Math algorithm for frequency analysis | Device or software for measuring spectrum |
| Usage | Inside software, tools, and devices | Standalone hardware/software or part of instruments |
| Output | Data array (can be graphed) | Graphical display, real-world units |
| Flexibility | Very flexible (depends on implementation) | Depends on device features |
| Real-Time Analysis | Possible, but depends on speed | Usually real-time (especially digital models) |
Practical Uses And Examples
To see the difference, let’s look at real-world situations.
Example 1: Audio Engineering
An audio engineer wants to find unwanted frequencies in a recording. He uses a software spectrum analyzer, which uses FFT inside. He can see peaks at certain frequencies and adjust them with equalizers.
Example 2: Radio Frequency Testing
A technician needs to check if a wireless microphone is interfering with other devices. He uses an RF spectrum analyzer. This tool scans across frequencies and shows any strong signals—helping him find and fix problems.
Example 3: Machine Vibration
A factory worker suspects that a motor is vibrating too much. She uses a vibration sensor, and the data is analyzed with FFT. The result shows which frequencies are strongest, helping her pinpoint the cause.
Example 4: Diy Projects
Many hobbyists use cheap USB devices and free software to analyze sound. The software uses FFT to display the spectrum. It’s not as accurate as professional spectrum analyzers, but it works for basic needs.
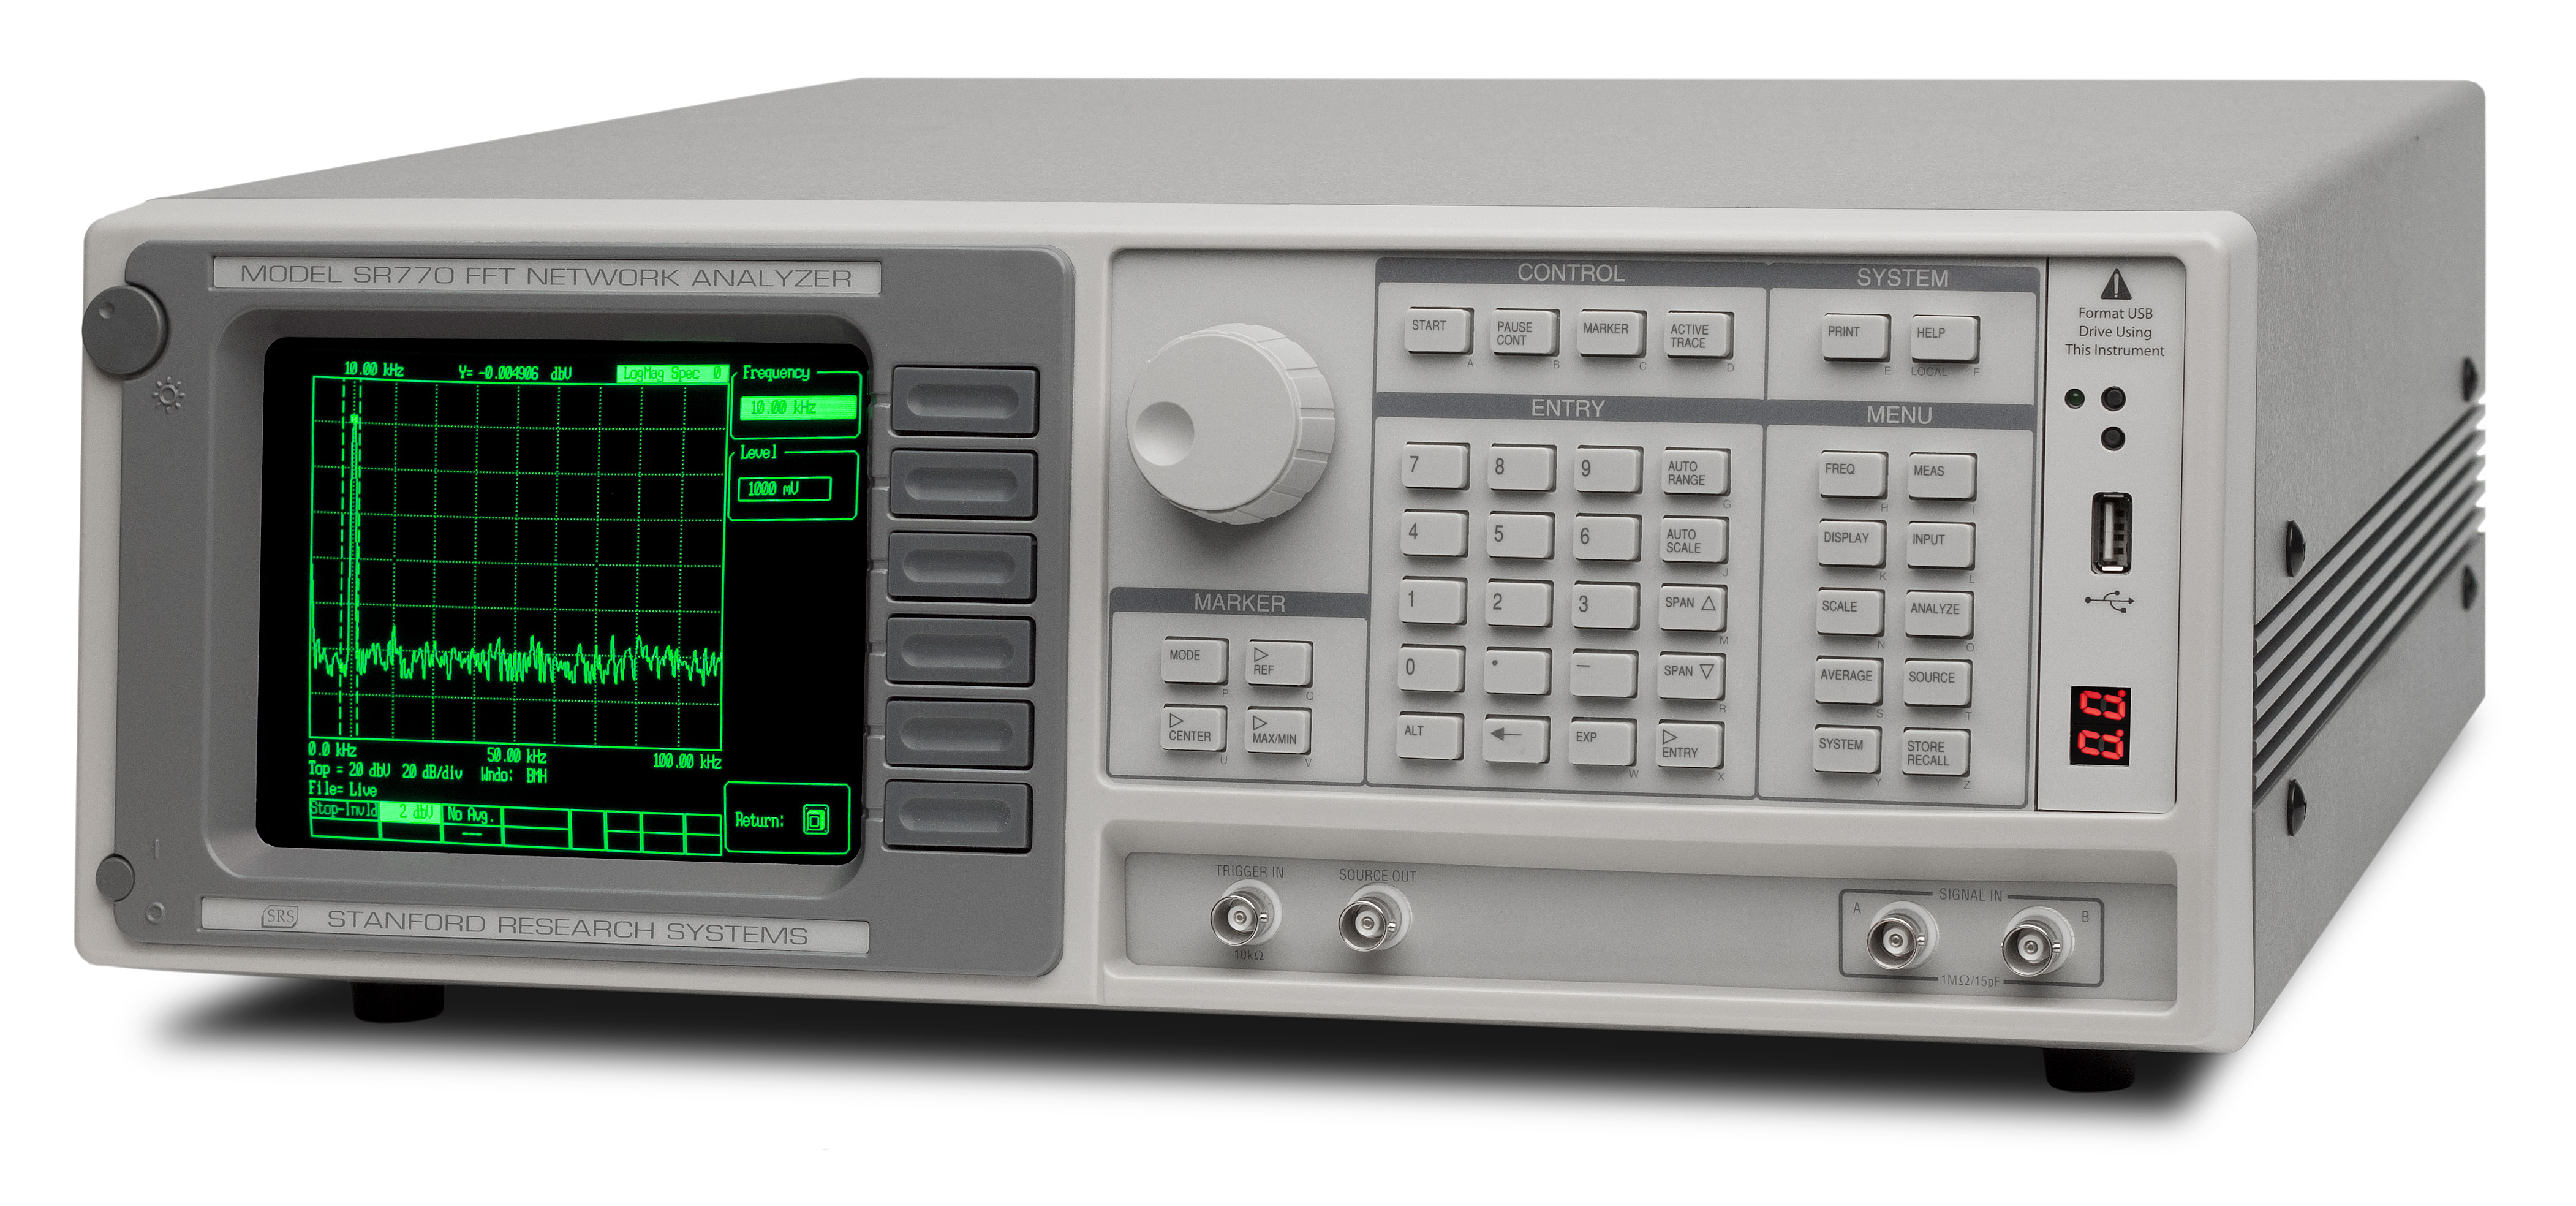
Credit: www.thinksrs.com
Comparing Accuracy, Speed, And Cost
When choosing between FFT and spectrum analyzers, you need to look at accuracy, speed, and cost. Here’s a quick comparison.
| Aspect | FFT | Spectrum Analyzer |
|---|---|---|
| Accuracy | Depends on sample rate, bit depth, and windowing | High, especially in professional devices |
| Speed | Very fast (real time possible) | Real time, but hardware may limit scan speed |
| Cost | Free or low-cost (software) | Can be expensive (hardware); software is cheaper |
| Ease of Use | Needs technical knowledge | Plug-and-play, easier for beginners |
| Portability | Software is portable; hardware less so | Portable models available |
Choosing The Right Tool
The choice depends on your needs:
- For quick analysis in software: FFT is perfect. Use it in audio editing, signal processing, or research.
- For field work and hardware testing: Spectrum analyzers are better. They are designed for real-world signals and have easy-to-use interfaces.
- For deep research: FFT gives you more control. You can customize settings, analyze raw data, and even build your own tools.
- For troubleshooting: Spectrum analyzers are easier. They show results in real-world units, with clear displays and controls.
Things Beginners Often Miss
- FFT is inside many spectrum analyzers: Digital spectrum analyzers often use FFT to process signals. So, when you use a spectrum analyzer, you might be using FFT without knowing it.
- Spectrum analyzers can be analog: Not all spectrum analyzers use FFT. Some older models use analog filters.
- Settings matter: Both tools need correct settings (sample rate, window, frequency range) for best results. Wrong settings can hide real problems or show false ones.
Advanced Tips For Better Analysis
If you want more accurate results, keep these points in mind:
- Use proper window functions: For FFT, use windows like Hanning or Blackman to reduce leakage.
- Check calibration: Spectrum analyzers need calibration for correct amplitude readings.
- Understand noise floor: Every tool has a limit. Weak signals may be hidden below the noise floor.
- Record and compare: Save your results and compare over time. This helps find trends or problems that appear slowly.
Data Table: Window Functions Impact
To show how window functions affect FFT results, see the comparison below.
| Window Function | Leakage Reduction | Frequency Resolution |
|---|---|---|
| Rectangular | Poor | Best |
| Hanning | Good | Moderate |
| Blackman | Very Good | Lower |
Real-world Statistics
- In 2023, the global spectrum analyzer market was valued at $1.5 billion.
- Over 70% of audio software uses FFT for spectrum analysis.
- Professional RF spectrum analyzers can detect signals as weak as -160 dBm.
- FFT algorithms are used in over 90% of digital signal processing applications.
These numbers show how common and important both tools are in science and industry.
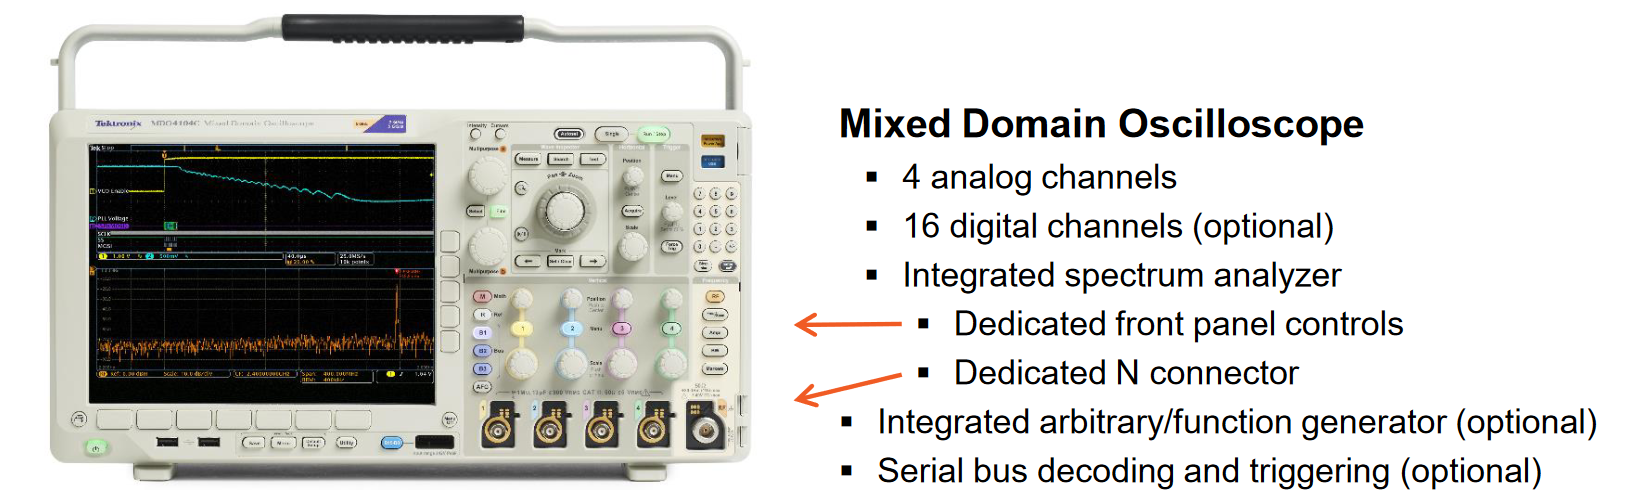
Credit: www.tek.com
Frequently Asked Questions
What Is The Main Purpose Of Fft?
FFT is used to break down a signal into its frequency parts. It helps to find out which frequencies are present and how strong they are, in a fast and efficient way.
Can A Spectrum Analyzer Work Without Fft?
Yes, analog spectrum analyzers do not use FFT. They use physical filters to separate frequencies. Digital spectrum analyzers almost always use FFT or similar algorithms.
Which Is Better For Audio Analysis: Fft Or Spectrum Analyzer?
For simple audio analysis, FFT-based software is enough. For professional studio work, a dedicated spectrum analyzer gives more accurate and easier results.
Is Fft Real Time?
FFT can be real time if the computer is fast enough. Most modern devices and software can process audio or signals instantly using FFT.
Are Spectrum Analyzers Expensive?
Hardware spectrum analyzers can be expensive, starting from hundreds to thousands of dollars. Software spectrum analyzers are much cheaper, and some are even free.
Final Thoughts
FFT and spectrum analyzers are both powerful tools for signal analysis. FFT is a math method that powers many software tools. Spectrum analyzers are devices or apps that measure real-world signals and show their spectra. Knowing the differences helps you pick the right tool, set it up correctly, and get reliable results.
If you want to learn more about spectrum analysis in engineering, you can visit Wikipedia for detailed information.
Whether you’re a beginner or an expert, understanding how FFT and spectrum analyzers work will improve your signal analysis and help you solve problems faster and more confidently.
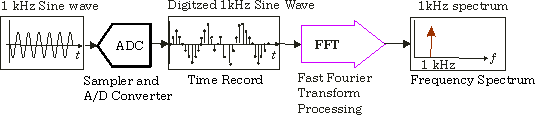
Credit: helpfiles.keysight.com