Signal Source Analyzer Vs Spectrum Analyzer
Measuring signals is a crucial task in electronics, radio, and communications. Two main tools are used: the signal source analyzer and the spectrum analyzer. Both devices look similar, but their purpose and features are different. For beginners, understanding these differences is vital before making a purchase or using them in the lab.
Engineers, students, and technicians often confuse these analyzers, thinking they are interchangeable. But using the wrong instrument can lead to inaccurate results, wasted time, or even damaged equipment. This article will explain how each analyzer works, their unique strengths, and which is best for different tasks.
You’ll also see practical examples, comparison tables, and answers to common questions.
What Is A Signal Source Analyzer?
A signal source analyzer is a device that measures the quality and characteristics of signal generators. These are used to produce stable frequencies for radios, cell phones, satellites, and lab testing. The analyzer focuses on checking how “clean” and stable the output from these generators is.
Key Functions
- Phase noise measurement: Measures tiny fluctuations in the signal’s phase. This is critical in radar, wireless, and satellite systems.
- Frequency stability: Checks if the signal keeps a steady frequency or drifts over time.
- Output power: Measures how strong the signal is.
- Harmonic and spurious analysis: Finds unwanted frequencies that may cause interference.
Typical Users
- RF engineers
- Telecommunication specialists
- Designers of oscillators
- Scientists working with atomic clocks
Example
A company making crystal oscillators uses a signal source analyzer to check phase noise. Low phase noise means better performance in GPS receivers and communication satellites.
What Is A Spectrum Analyzer?
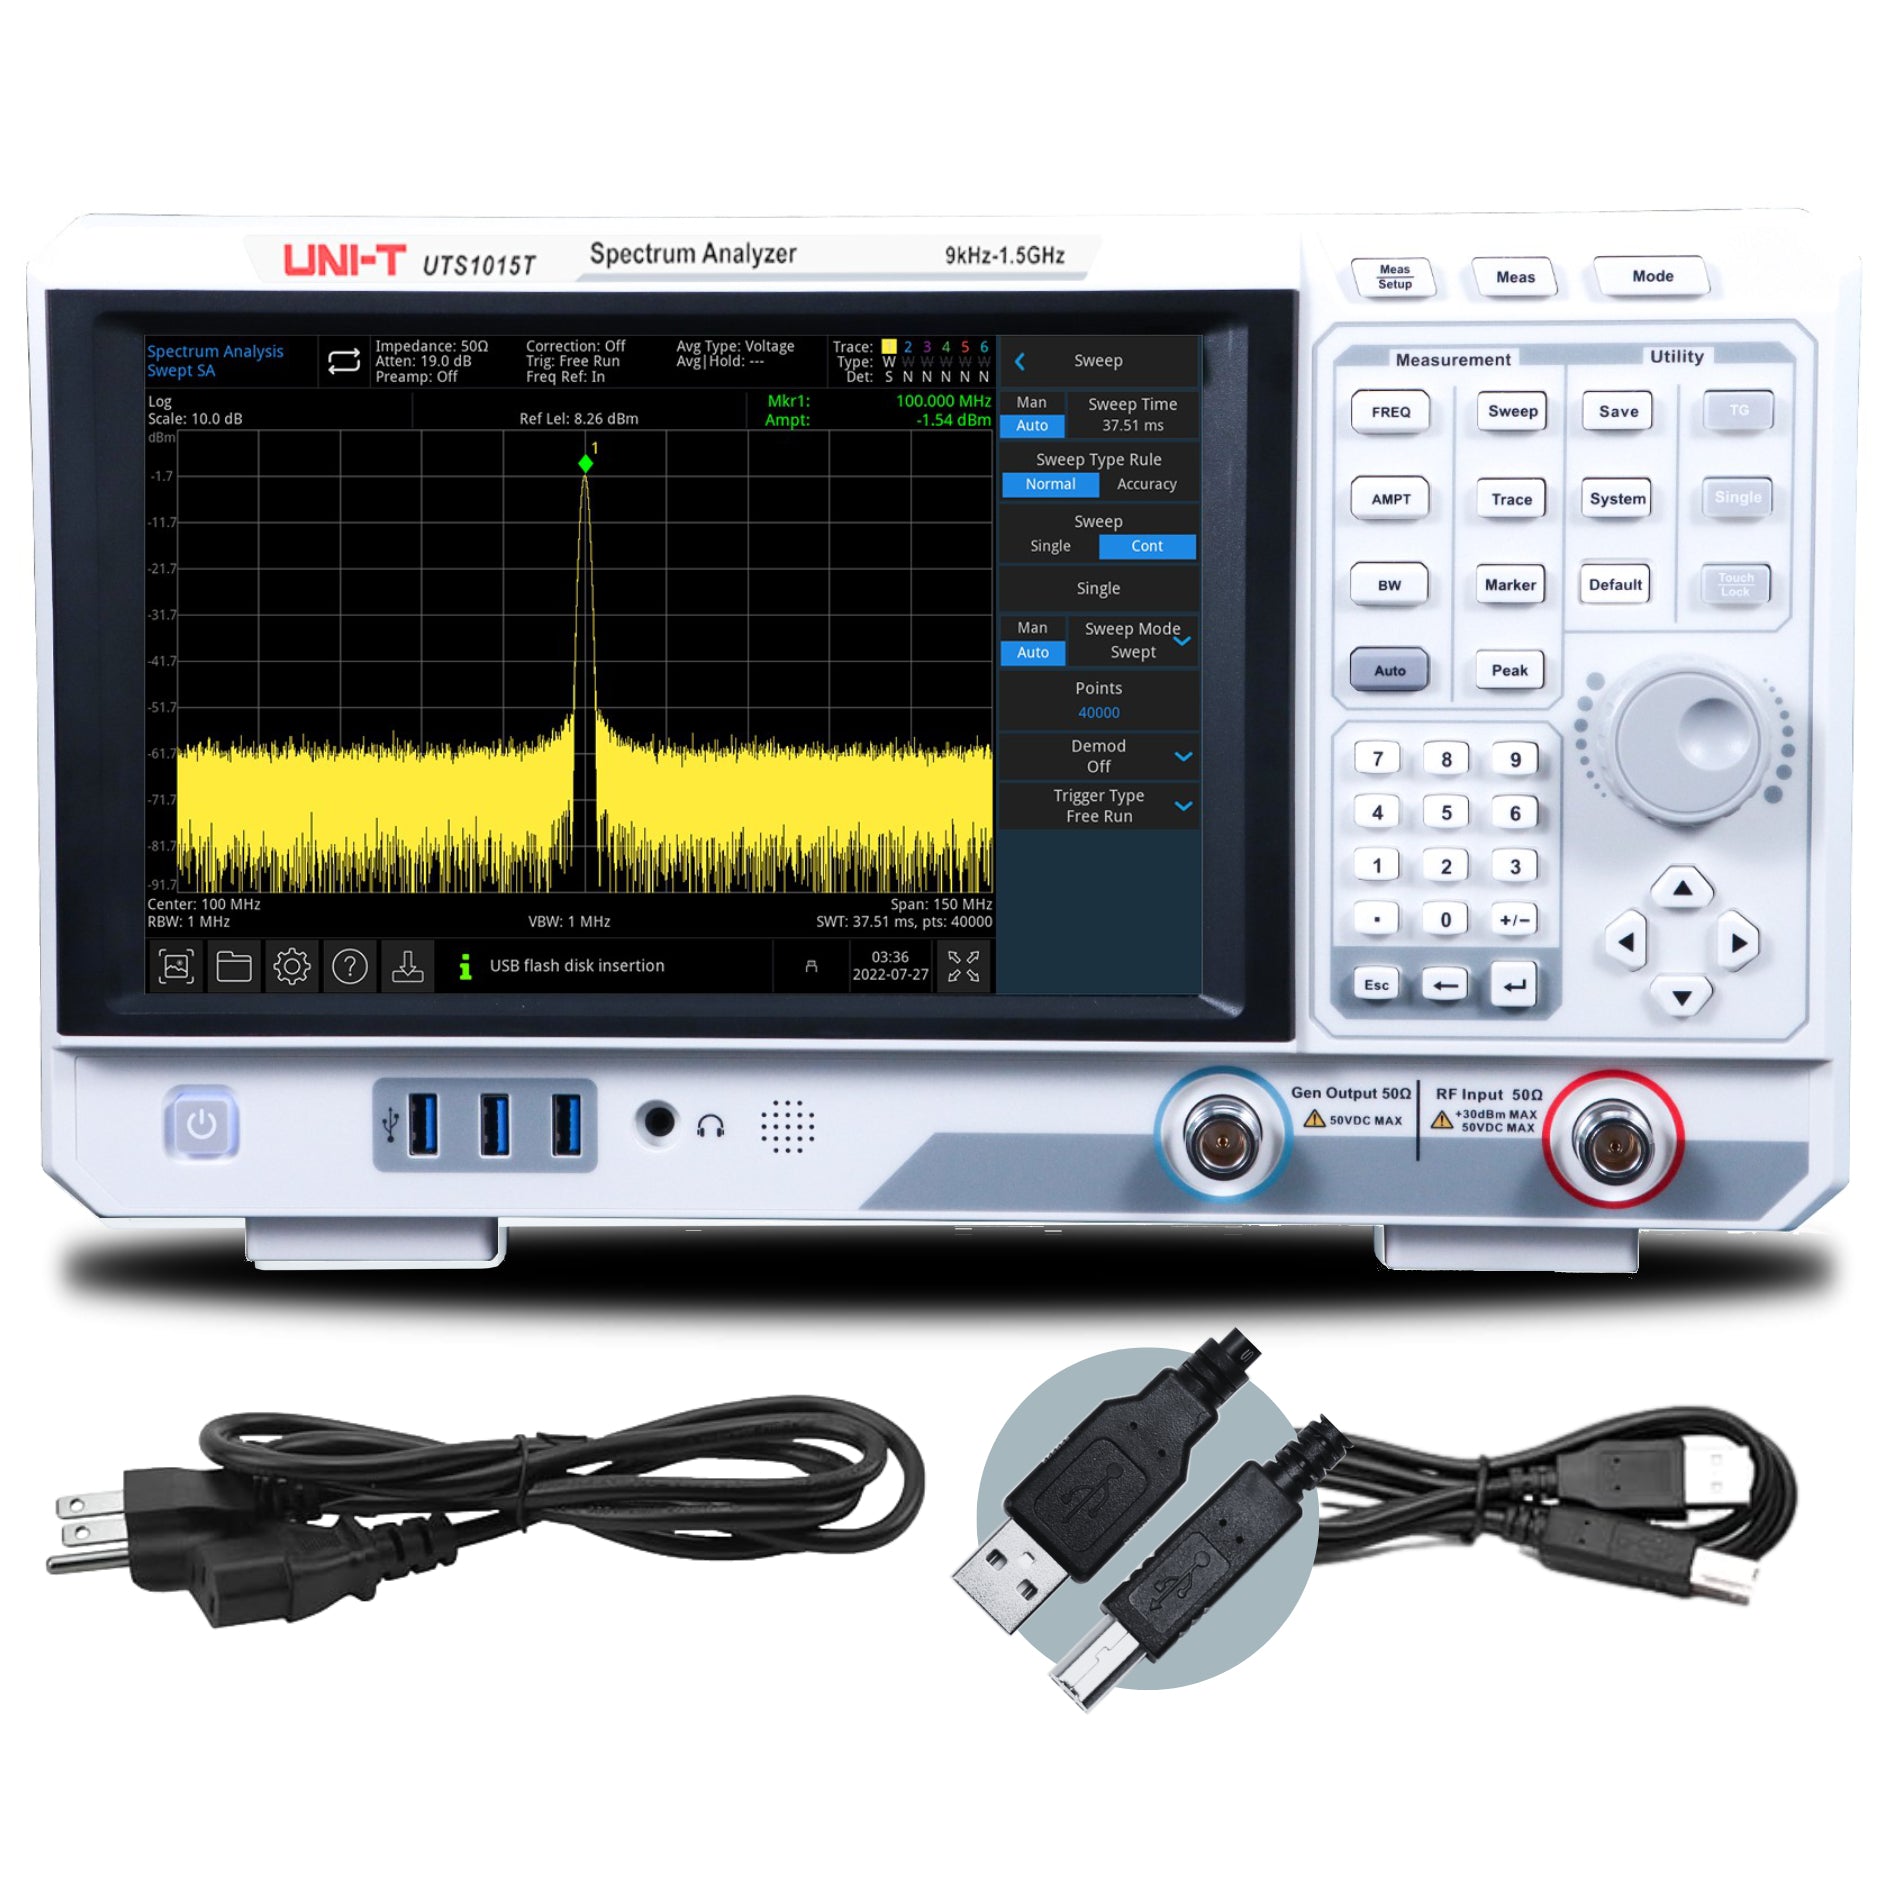
A spectrum analyzer measures the amplitude of signals across a range of frequencies. It displays these signals as a graph, showing which frequencies are present and how strong they are. This tool is mainly used to analyze the content of radio signals, detect interference, and troubleshoot electronics.
Main Features
- Frequency domain analysis: Shows which frequencies are in a signal and their strength.
- Wide bandwidth: Can scan large ranges, from audio to microwave frequencies.
- Peak detection: Finds the strongest frequencies.
- Noise floor measurement: Shows the lowest detectable signal.
Typical Applications
- Wireless communication testing
- Broadcast engineering
- EMI/EMC testing
- Audio analysis
Example
An engineer fixing a WiFi router uses a spectrum analyzer to find sources of interference. The device shows unwanted signals from nearby devices, helping the engineer pick a cleaner channel.
Credit: uni-trendus.com
Core Differences: Signal Source Analyzer Vs Spectrum Analyzer
Understanding the main differences helps you choose the right tool. Let’s compare their core aspects:
| Feature | Signal Source Analyzer | Spectrum Analyzer |
|---|---|---|
| Primary Function | Measures signal purity & stability | Shows frequency content & amplitude |
| Key Metrics | Phase noise, frequency stability, spurious signals | Signal strength, frequency range, noise floor |
| Typical Use | Testing oscillators, signal sources | Analyzing communication signals, EMI |
| Frequency Range | Usually narrow, focused on specific frequencies | Wide, covers from kHz to GHz |
| Display | Numeric or phase noise graphs | Spectrum (amplitude vs frequency) |
Non-obvious Insights
- Signal source analyzers often require special reference sources for accurate phase noise measurement. Beginners may overlook this and get incorrect results.
- Spectrum analyzers can show spurious signals but may not accurately measure phase noise unless they have special options.
How Each Analyzer Works
Signal Source Analyzer
This device uses a reference oscillator for comparison. It splits the signal from the generator and mixes it with the reference. The analyzer then measures the difference, showing how much the signal “wobbles” or fluctuates.
- Phase noise measurement is usually done at specific “offsets” from the main frequency. For example, measuring noise 10 kHz away from a 1 GHz signal.
- Spurious analysis checks for unwanted frequencies that are not harmonics.
Spectrum Analyzer
A spectrum analyzer takes an input signal and sweeps across a range of frequencies. It uses filters and mixers to isolate each frequency and measure its amplitude.
- Resolution bandwidth (RBW) controls how detailed the measurement is. Narrow RBW shows fine details but takes longer.
- Sweep time is how long it takes to scan the range. Fast sweep may miss weak signals.
| Measurement Technique | Signal Source Analyzer | Spectrum Analyzer |
|---|---|---|
| Comparison with Reference | Yes, for phase noise | No, measures input directly |
| Frequency Sweep | Rare, mainly focused on single frequency | Common, scans wide frequency ranges |
| Graph Output | Phase noise plot, numeric readouts | Spectrum graph (amplitude vs frequency) |
Selecting The Right Analyzer
Choosing between a signal source analyzer and a spectrum analyzer depends on your task. Let’s look at the factors:
When To Choose A Signal Source Analyzer
- You need accurate phase noise measurements: For designing oscillators, synthesizers, or precision clocks.
- You must check frequency stability: Useful in satellite and cellular systems.
- You need to detect spurious signals: Critical for devices used in sensitive environments (e.g., medical or military).
When To Choose A Spectrum Analyzer
- You want to see all frequencies in a signal: Useful for troubleshooting, finding interference, or analyzing audio signals.
- You need to measure signal strength across a range: For wireless networks, broadcast systems, or EMI testing.
- You need a flexible tool: Spectrum analyzers cover many applications, from audio to microwave.
Mistakes Beginners Make
- Using a spectrum analyzer for phase noise measurement. It’s possible, but results are often unreliable unless the analyzer has phase noise options.
- Ignoring reference sources in signal source analyzers. Without a good reference, phase noise measurements can be meaningless.
- Not setting proper resolution bandwidth in spectrum analyzers. Too wide, and you miss weak signals; too narrow, and the sweep is too slow.
Real-world Applications
Signal Source Analyzer Example
A team designing a new GPS receiver uses a signal source analyzer to test their crystal oscillator. Low phase noise means better positioning accuracy. They measure at several offsets (1 kHz, 10 kHz, 100 kHz) to ensure their device meets strict standards.
Spectrum Analyzer Example
An audio engineer checks the output of a mixing desk. A spectrum analyzer displays the full frequency range, helping the engineer spot unwanted noise and adjust the equalizer for the best sound.

Credit: www.testequity.com
Price And Performance Comparison
Both analyzers are investments. Here’s a quick comparison of typical prices and performance:
| Analyzer Type | Entry-Level Price (USD) | Professional Price (USD) | Accuracy | Key Brands |
|---|---|---|---|---|
| Signal Source Analyzer | $8,000 | $50,000+ | Very high for phase noise | Keysight, Rohde & Schwarz |
| Spectrum Analyzer | $1,000 | $25,000+ | High for spectrum display | Tektronix, Anritsu |
- Signal source analyzers are more expensive due to their specialized measurement ability.
- Spectrum analyzers are more common and have wider price ranges.
Advanced Features
Signal Source Analyzer
- Cross-correlation: Reduces measurement noise by averaging results from two channels.
- Automated testing: Software can run multiple tests and create reports.
Spectrum Analyzer
- Real-time analysis: Captures fast-changing signals without missing peaks.
- Digital storage: Saves results for later review or sharing.
Insight
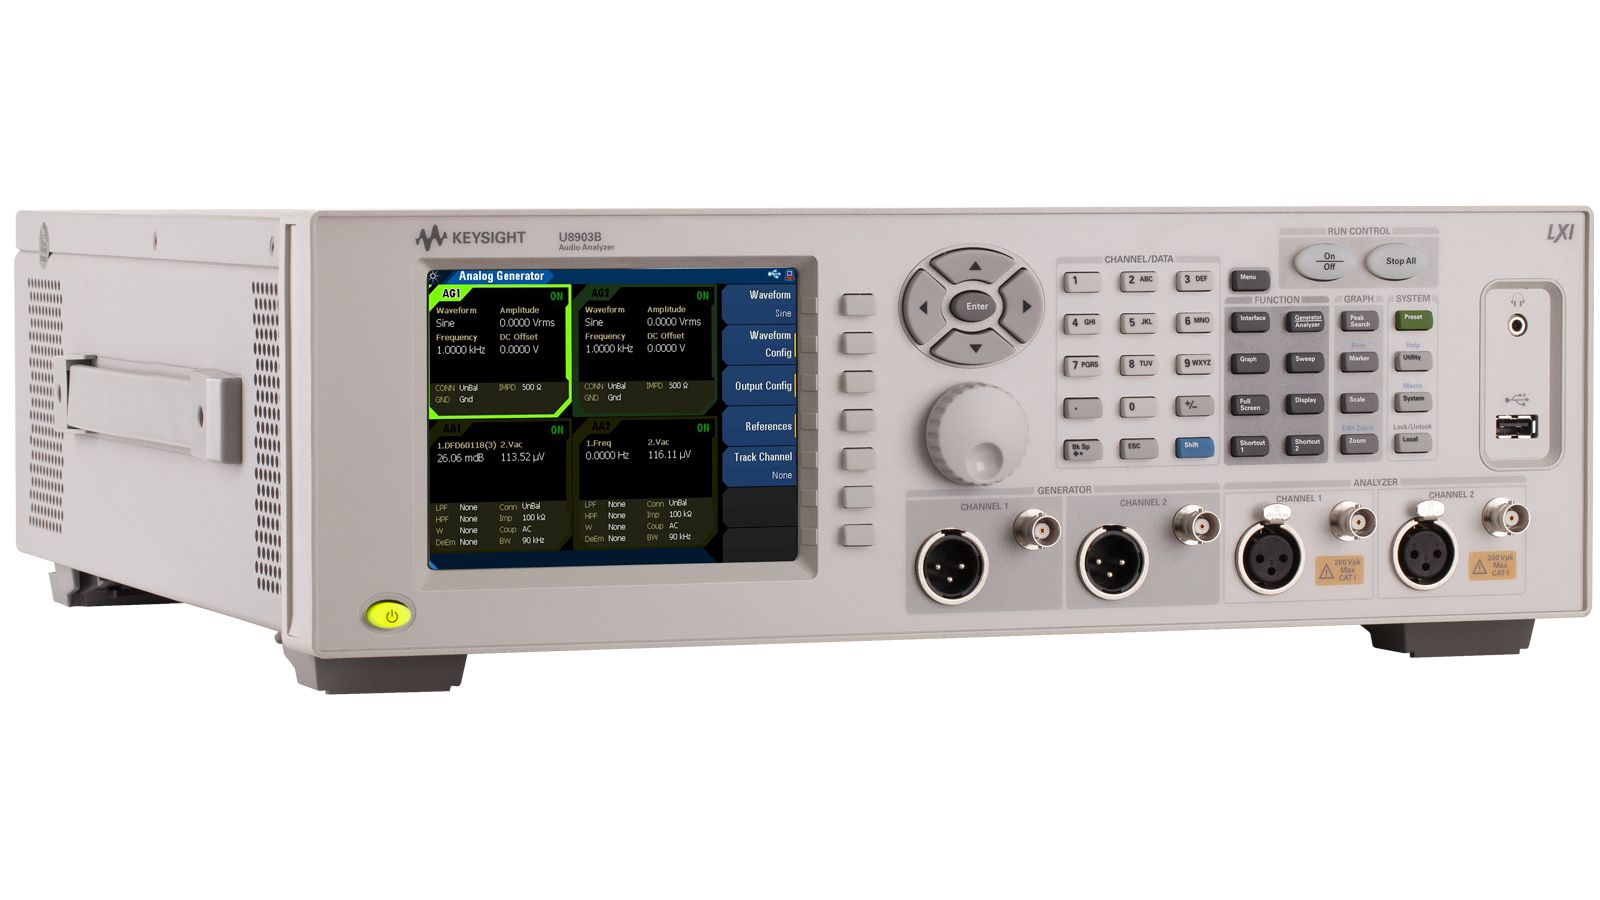
Many modern spectrum analyzers now offer some phase noise measurement features, but they are not as accurate as dedicated signal source analyzers. If you need precise phase noise, always choose the specialized device.
Credit: www.keysight.com
Practical Tips For Beginners
- Check calibration: Both analyzers need regular calibration for accurate results.
- Use proper connectors: Bad cables or adapters can distort measurements.
- Read the manual: Each analyzer has unique settings and options—missing these can lead to errors.
- Start with known signals: Test with a signal you understand to check the analyzer’s setup before measuring unknowns.
Frequently Asked Questions
What Is Phase Noise And Why Is It Important?
Phase noise is small, random changes in a signal’s phase. It matters because it can cause errors in communication systems, reduce accuracy in GPS, and limit performance in radar. Signal source analyzers measure phase noise very accurately.
Can A Spectrum Analyzer Measure Phase Noise?
Some spectrum analyzers have options for phase noise measurement, but results are usually not as precise as with a dedicated signal source analyzer. For high-accuracy work, use the proper device.
Are Signal Source Analyzers And Spectrum Analyzers Interchangeable?
No, they are not. Signal source analyzers specialize in measuring stability and purity of sources, while spectrum analyzers show the frequency content and strength. Using the wrong tool may lead to poor results.
How Often Should Analyzers Be Calibrated?
Calibration depends on usage and manufacturer recommendations. For critical measurements, calibrate at least once a year. Always check before starting important tests.
Where Can I Find More Information About Measurement Standards?
The IEEE and other organizations publish standards for electronic measurements. For deeper details, visit Wikipedia.
Choosing between a signal source analyzer and a spectrum analyzer depends on your testing needs. Understanding their functions, strengths, and limits will help you make the right decision and avoid common mistakes. With careful setup and regular calibration, you can get reliable results and improve your electronics work.